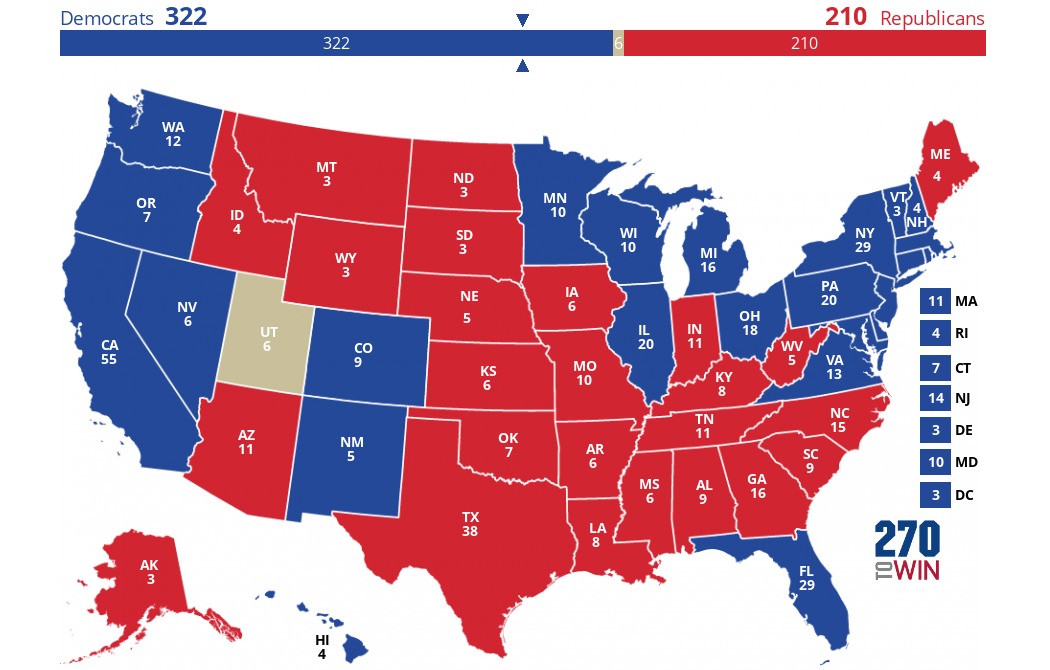
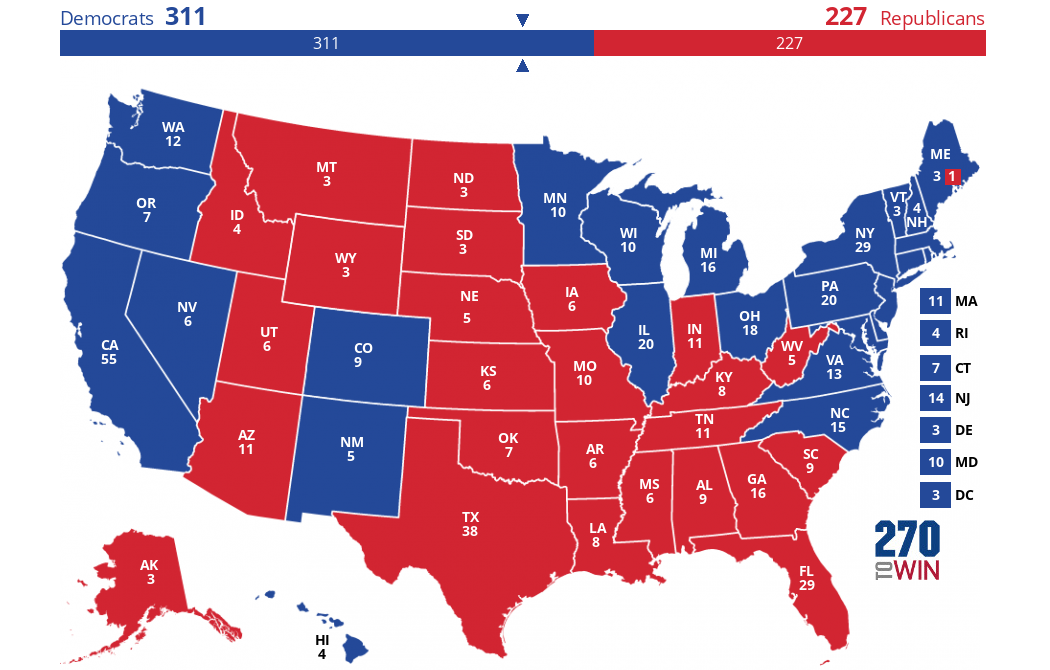
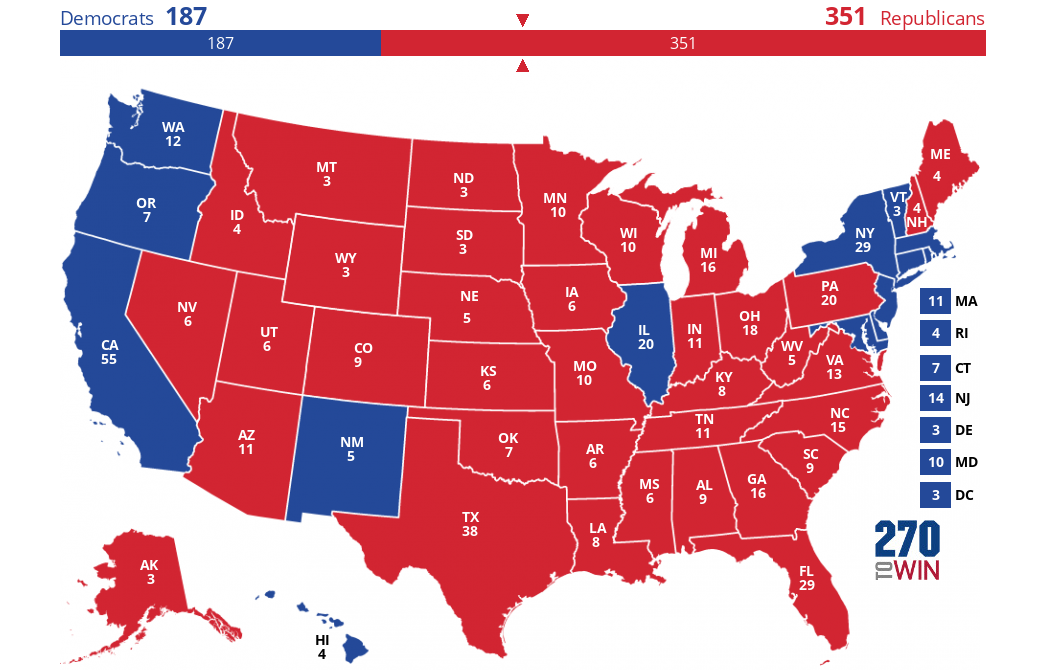
No. NO NO NO. A thousand times NO. This is not how you do statistics. I'm not doing ANYTHING in my favor. You're just citing an improper statistic. This is a fundamental flaw with RealClearPolitics. For the bazillionth time and one, if you average a multivariable (i.e. multiple candidates, in this case) sample with other multivariable samples, what you create is a statistically meaningless number with how you're trying to use it. If five sample says Trump is at 40 and the next five says Trump is at 60, Trump is NOT at 50. No sample has suggested that Trump is at 50. Trump is most likely at 40 or at 60 -- since his results are bimodal, with a gap in between, you can't just average these numbers. At least, not without understanding what the result generates.
As you know, RCP creates a Poll Average vs. Time chart. This DOES adequately describe how the candidates have been performing in polls, over time. i.e. YES, recent polls on average are higher for Trump. That ABSOLUTELY IS NOT THE SAME THING as suggesting Trump is LEADING in the polls. He led in A SINGLE POLL. A single poll is a single indicator.
The only way you can ever blindly average these numbers like RCP does with 100% guarantee is if the poll was a simple "are you voting for Donald Trump? Y/N." Then yes, you could average multiple samples without consequence.
Jesus. You must be the guy who makes EXCEL produce 8th degree polynomial fits just because it makes your r-squared value perfect.


")